Shared Mobility in the Stork City
Stories and data of Shared Mobility in The Hague.
Analytics and visualisations by Shajee, Kevin,
Mikhail & Jin.
Map by Mikhail.
Messy Adventures and this website by Connor.
For the Hackathon-for-Good.
November 27-29, 2020.

Shared mobility. What is it? How does it work in our city now? And how can it help us, from a single individual, to the entire planet?
These are all complex questions. Without any clear, simple answers. It's a messy problem, from the situation on the ground, to the data itself, and even the stories we tell ourselves about it all. We set out to gain a better understanding of all of that and more. So, what did we do in those two days?

Let's start simple.
Who uses shared mobility?
There are many ways to slice who uses what.
In the world of shared mobility: access, or at knowledge about access, is king. This is by far the most relevant factor that appears in the survey data we analyzed.
.png)

One way to look at this is to ignore the driver for a moment, and just look at the cars on the road. This graphic looks at what type of car shared mobility users are using. A majority of short trips are with a van, we presume this is everyone taking advantage of the service when they are moving, or just buying a new couch.


Repeat users are key to most services, and in the shared mobility data we have we can see that the single-trip users are very common. The X-axis is this graphic shows how users take each number of trips.
.png)

Scooters users are naturally younger, though it could be interesting to know how this splits between students, and different types of young workers.

When do they use it?
Afternoons are much more popular than mornings for traveling by shared mobility.
What about the types of trips? We were interested to see if the Dutch preference for planning ahead shows up in the data...sure enough, in-advance bookings far outstrip last-minute rides. Except for a narrow window early in the morning, where last-minute rides are for a moment more popular. We could assume these are the unlucky few who forgot to book in advance the night before, or worse, woke up to car trouble.

Scooters, and we believe bikes by proxy, peak in mid afternoon, shortly before cars. This reflects in general movement patterns of cities, as the workers go home and the night-owls start their day.

Where do they use it?
Two ways to visualise how shared mobility moves around the city.

Rush hour travel destination are centered in the working hubs, while naturally night travel is more distributed. Scooters are a regular form of transport to and from work for many people.
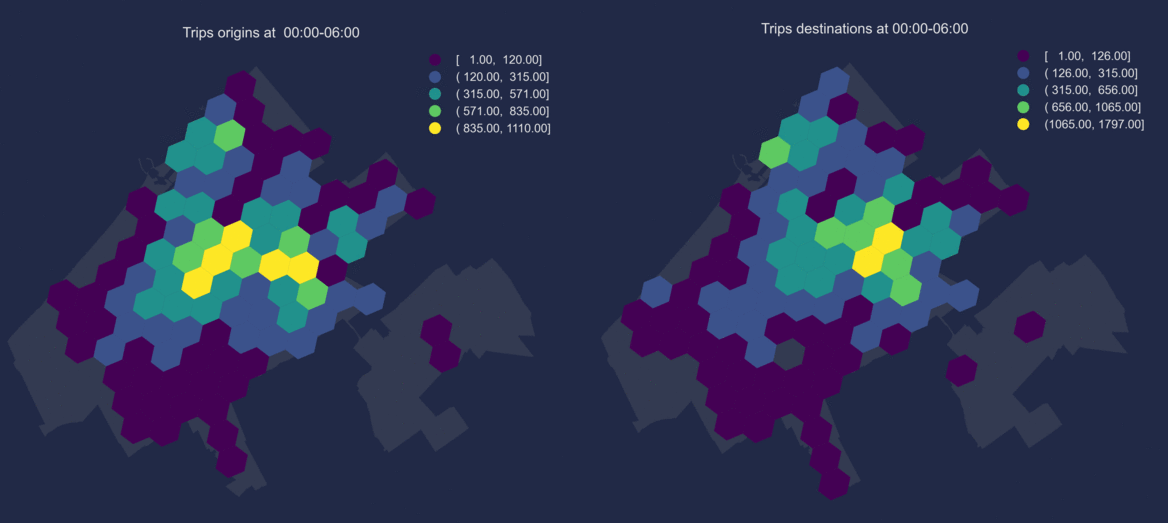
I like to call this map, the Shared Mobility Bicycle Super-Highways. Try not to lose track of time as you explore the city! Check the traffic on your route, at your house, or just follow it to see where everyone else goes!
B.C. / A.C.
Before. Corona. / After. Corona.
It's hard to say from this graphic, if the second lockdown or the coming winter is responsible for the decrease in uses. It is pretty cold outside, but it's likely that both are playing a part in dropped usage.
Now we're really in complicated waters. Corona virus is a paradigm shift, one that shows up clearly in the data we have that spans 2020. Of course this change doesn't take place in a vacuum, life still goes on, and shared mobility share was expanding at the same time. So in a sense, the adoption of shared mobility didn't change, over the long term it seems the trend will continue increasing.
.png)

Pulling it all together.
This data only tells part of the story. So, we used it to fuel our creative side, and created an anthology of non-linear stories. In these stories you will learn about CO2 emissions, the basics of shared mobility, and get a glimpse of what the future of shared mobility might look like. You also will go on a bad date, be late for work, and avoid probing questions from your mother about your love life. Enjoy!
Designed & Written by
Connor McMullen
in Twine
Our Key Insights
As you can see, the data and stories of shared mobility in The Hague are many. We covered a lot of ground, and we still feel like we're only scratching the surface. Sill, we have taken at least three key insights away from our work.
1. C02 Savings
We estimate that on appproximately 4.2 tons of Carbon were saved by shared mobility last year. Their average distance saved by using Greenwheels is around ~1970km per year. Increasing this number will have beneficial impact on the car usage in the City.
2. Reducing Car Ownership
Based on our research, each shared mobility car replaces between 5-15 privately owned cars. One thing that we can say, is that shared mobility locations in the city more definitely increase traffic in general. Survey data also showed that 45% of users who have access to shared mobility cars stop owning a private vehicle.
3. Coalition Building
The shared mobility market is extremely fragmented. This poses an excellent opportunity for building coalitions between multiple actors and leveraging the strengths of market economics to fuel innovation and provide the best services to all citizens. A more equal distribution of facilities would allow us to release the city center from over-use and prevent the growth of feedback loops that build off of past choices. A good policy for the future may combine several forms of shared mobility with a spoke-and-hub systems that places more cars outside of the heavy traffic area, creating a chain of mobility modes from the door, to a pick-up point, or anywhere else you need to go.
One last thing...
If we were all had to add a fourth insight, it would probably be something like this. As policy analysts we often see certain patterns in our work. Unfortunately, during our investigations, we saw the first signs of a familiar pattern begin to emerge. Access to shared mobility is at risk of adopting some of the worst features of the systems it has grown from: unequal distribution of services disenfranchising the already underserved even further. Shared mobility is an opportunity for our least privileged neighbours to use the infrastructure the rest of us take for granted.
The lower the property value, the much more likely you have to travel a greater distance to shared mobility.

A tell-tale patch of purple snakes towards the center of the map, familiar to any who have studied our city. This area of the city, beyond the market and along the train tracks, is home to many low-income, first- & second-generation immigrants. Providing shared mobility access to these families can reduce carbon emissions and street congestion, while also offering them additional means of transport flexibility that they did not enjoy before.

About the team!
Five friends from five nations, four alumni (and one soon-to-be) of TU Delft's Engineering and Policy Analysis Master's Program, they joined this hackathon because they missed staying up all weekend to work on deadlines.

Connor
Jin
Mikhail
Shajee
also
Shajee
Kevin
Connor is a storyteller based in The Hague, Netherlands. For this hackathon he wrote the Messy Anthology and created this website. Over the weekend he learned to love the cyberpunk color palette. His greatest accomplishment was not being the one to open the bag of chips that sat on the table for two days.
Kevin loves everything related to tech and geek culture! Based in Rotterdam The Netherlands, studying in The Hague, on a campus from Leiden University, doing a master from TU Delft he utilizes data science, policy-making, and modelling for good. His greatest accomplishment? The one to open the bag of chips that sat on the table for two days.
Mikhail is a data scientist studying cities. He used his ninja skills (read simply as open-source software) to create data-driven visuals. This hackathon gifted him with a new existential question: “can any of these apps be a leverage point?” He is really happy that such a diverse team worked well together.
Jin Rui Yap, commonly mistakenly referred to as Yin Yap, is a master's student at the Engineering and Policy Analysis program at TU Delft. When she's not gobbling down Asian food, you can find her in a corner creating cool visualizations to support initiatives in disaster risk management. She also enjoys deciphering the meaning of urban resilience and working on policy solutions that can be useful for generating healthy and equitable urban development.
Shajee is a data science consultant at Capgemini Invent based in Germany. In this hackathon, he derived the important factors influencing citizens' decision to use shared mobility services. (Who knew that location is crucial!) During this weekend he learned about new ways and tools (Kepler ❤) to visualize city data. However, he certainly appreciated most the collaborative environment among great individuals.
References
Mobility and environmental impacts of car sharing in the Netherlands
Shared mobility – where now, where next? Second report of the Commission on Travel Demand
Shared Mobility: A Sustainability & Technologies Workshop: Definitions, Industry Developments, and Early Understanding
Identifying user classes for shared and automated mobility services
The roles of users in electric, shared and automated mobility transitions!
Den Haag leefbaar, verkeersveilig en bereikbaar houden
Hoofdlijnenbrief Mobiliteitstransitie (RIS302361)